Background
Social Vulnerability refers to a community's ability to prepare for and respond to a hazardous event. The Center for Disease Control (CDC) has compiled a Social Vulnerability Index (SVI) to quantify vulnerability for census tracts in the U.S. The CDC SVI data can be used to estimate needed supplies and resources, identify areas in need of emergency shelters, plan evacuations for those with special needs, and identify communities that could need additional support after a disaster. The index is a statistical calculation of 15 census-derived factors that cover risks for socioeconomic, household composition, minority status, and housing/transportation. The SVI data is available at the census tract level from the CDC website.
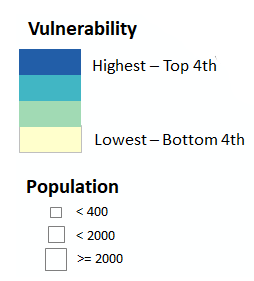
This geovisualization combines SVI census tract data with a 1-kilometer population grid to visually enhance populated areas and draw less attention to areas of low population.
Scale Comparison
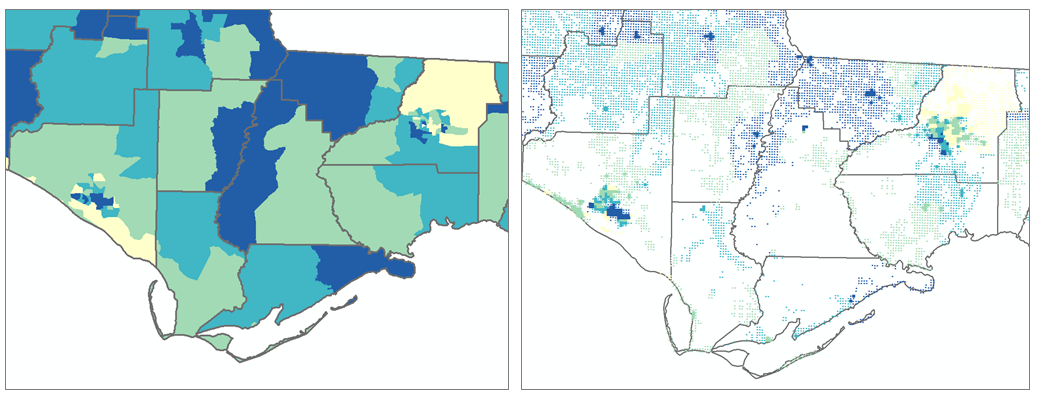
Left Map - SVI data at the census tract scale. It is impossible to estimate population
at risk in any area.
Right Map - SVI data filtered through a 1-km population grid. The result emphasizes the more populated areas and de-emphasizes the less populated.
For both images, the SVI data are the same. The only change is that the SVI data has been filtered through a 1-km population grid.
Sample Image
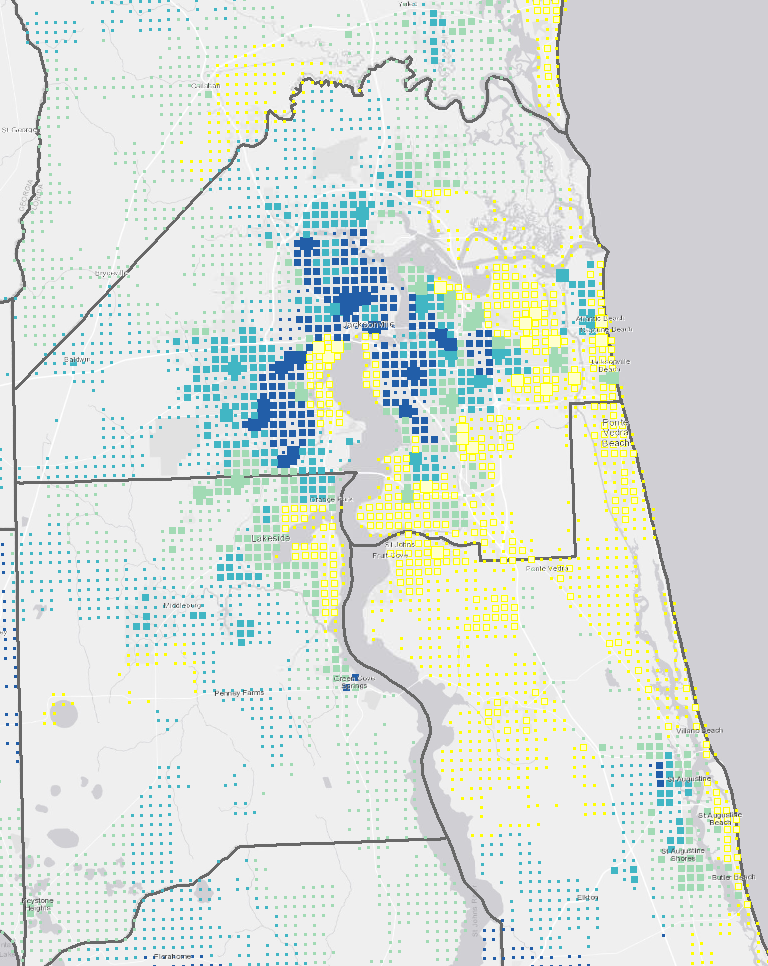
The above image around Jacksonville, Florida shows a variety of SVI risk levels and a mix of population totals.
Downloads
Conference Presentation
Metadata URL
Data Download (3 MB) Pre-styled data for ArcMap (mdx) and QGIS (qgs)

Florida 2016 Social Vulnerability Index visualized by population by FREAC is licensed under a Creative Commons Attribution 4.0 International License.
To cite this data:
FREAC (2019). Florida 2016 Social Vulnerability Index visualized by population [GIS Shapefile]. Tallahassee: Florida Resources and Environmental Analysis Center, Florida State University.
