Starter Datasets. Land Use / Land Cover
Background
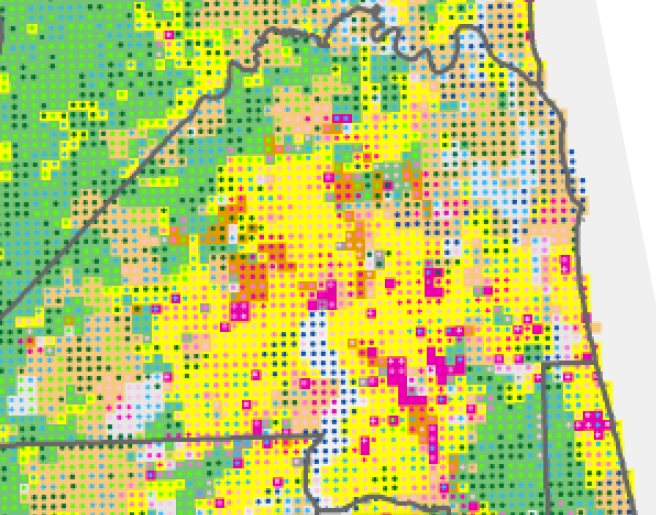
Research into bivariate methods of visualizing data led to our team to attempt a new way to visualize Land Use and Land Cover data. Land use is aggregated from the 2014 Florida Department of Revenue cadastral data. Land cover is derived from the 2011 National Land Cover Database. Both datasets were normalized to the 1-km USNG. A bivariate visualization using both color and symbology show the two landscape characteristics simultaneously. Further, flow diagrams provide an overview of the relationships between land use and land cover and complement
the GIS map.
Sample Image
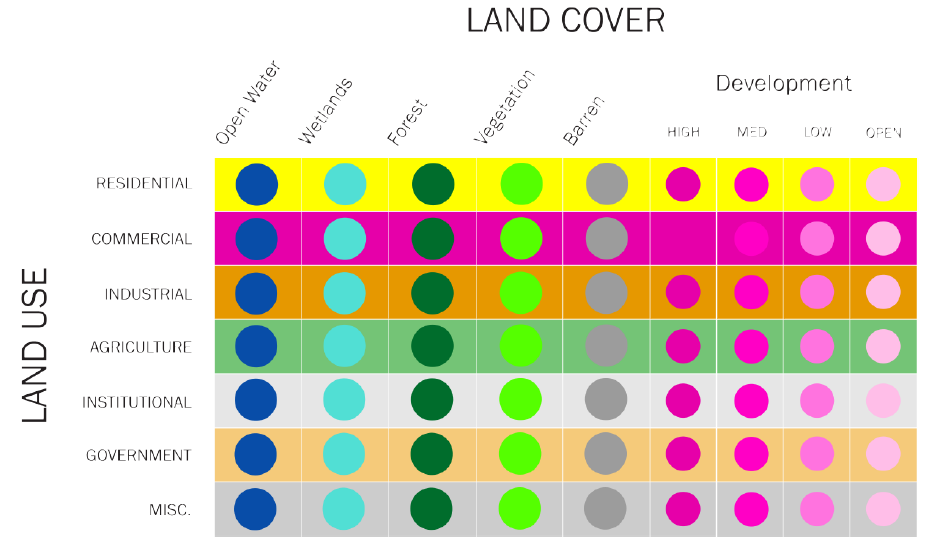
Legend
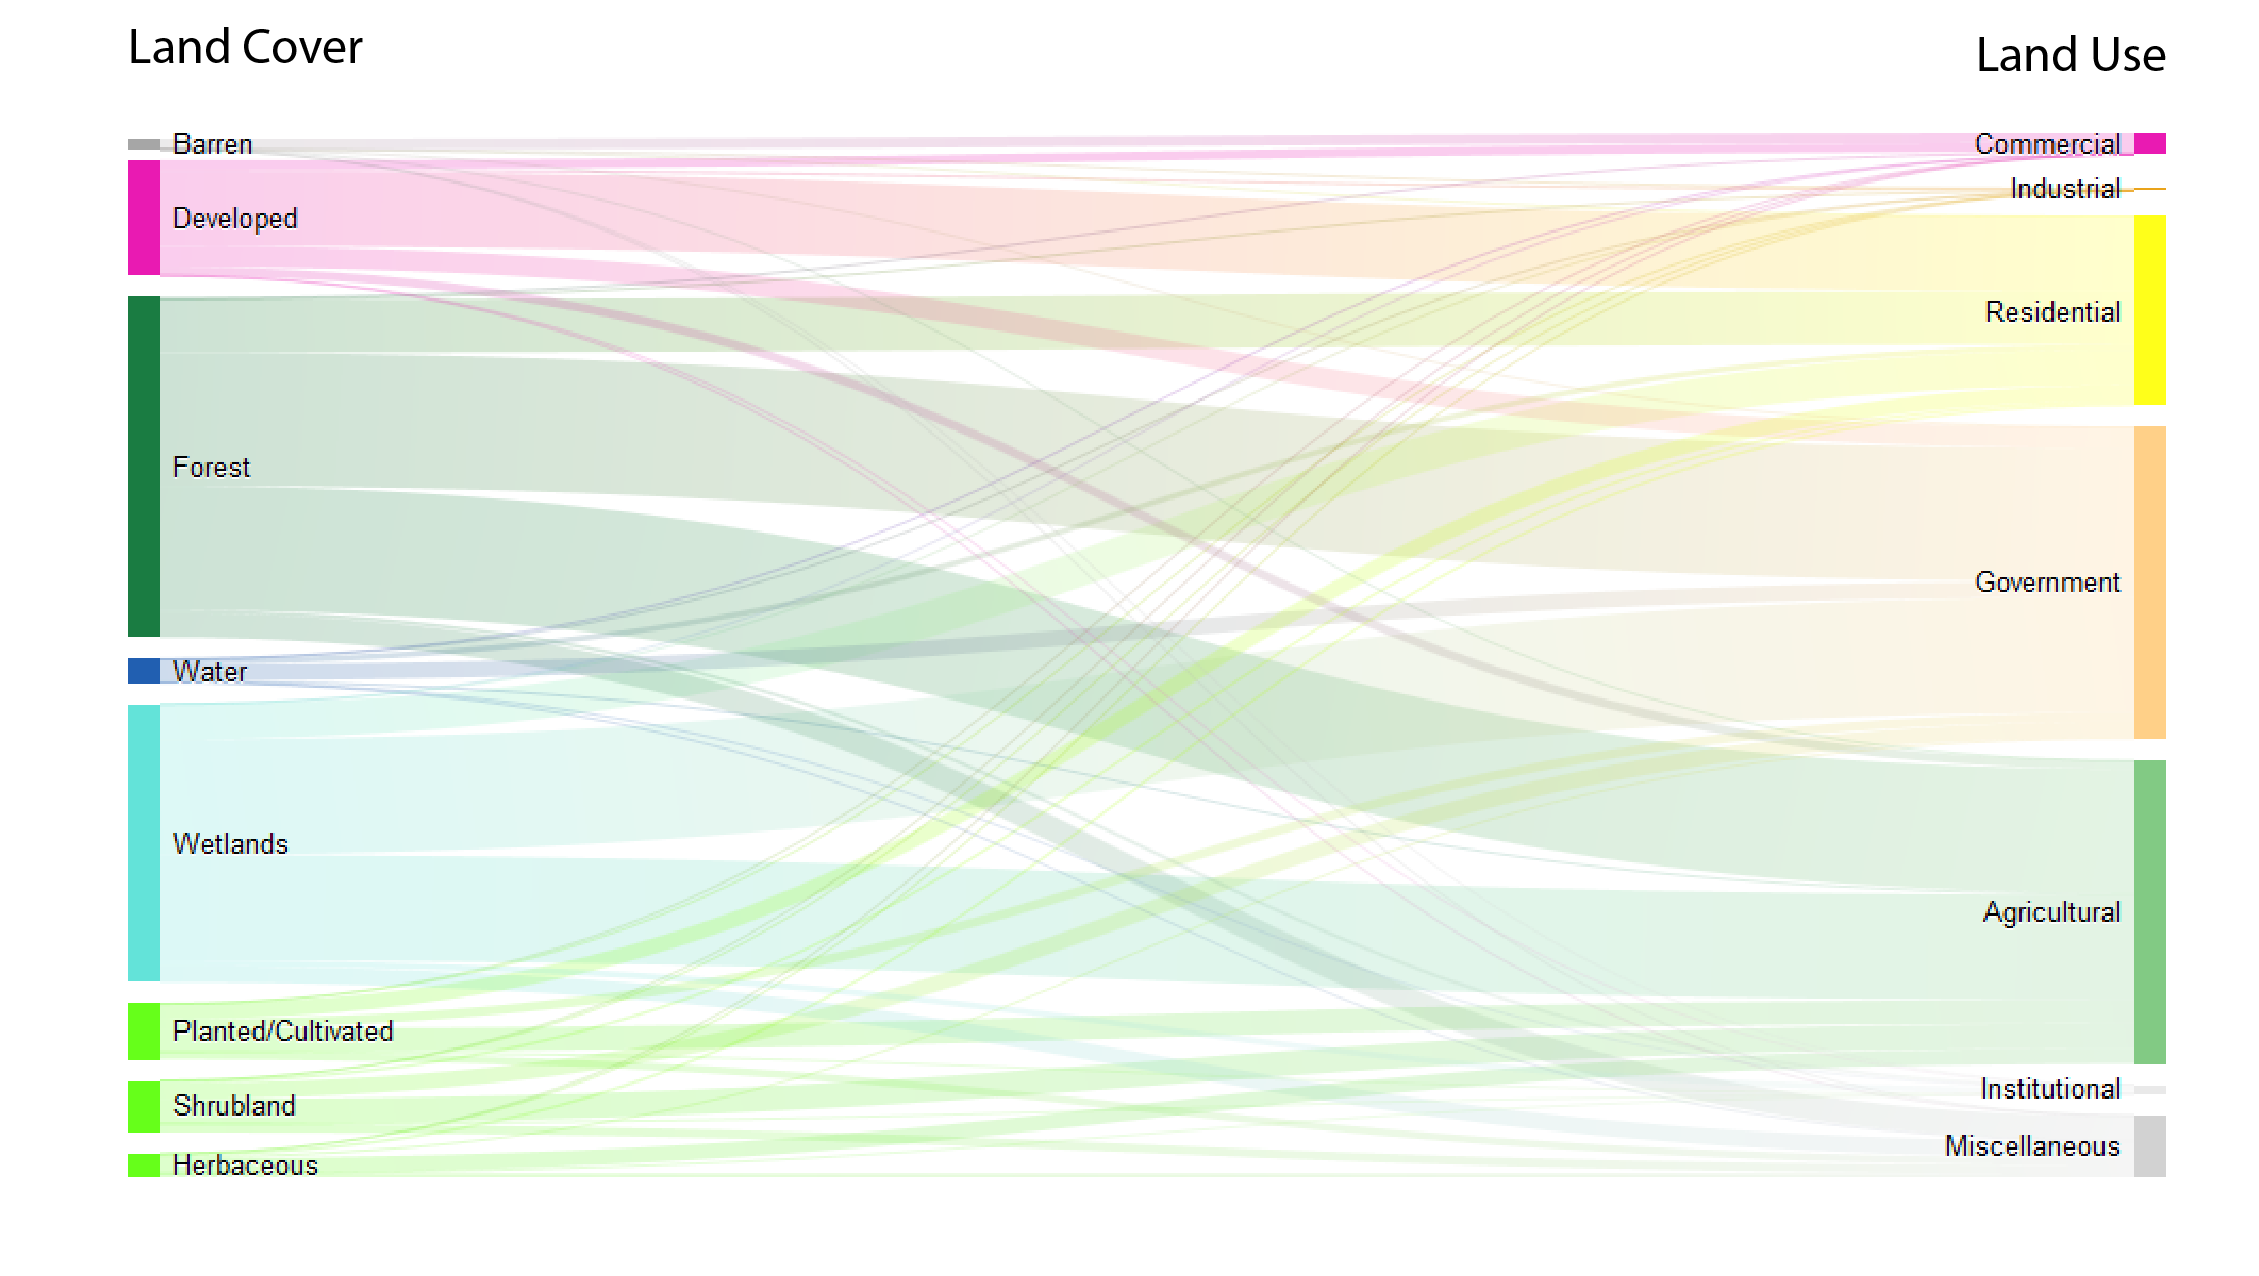
Relationships Between Land Use and Land Cover
Sankey diagrams are a specific type of flow diagram where the width of the connecting lines is shown proportionally to the quantity. Sankeys are typically used to visualize energy or material transfers between processes. In this
case, the connecting lines show the relationships between land use and land cover.

Land use or land cover? Visualizing Florida's Complex Landscape by FREAC is licensed under a Creative Commons Attribution 4.0 International License.
To cite this data:
FREAC (2016). Land use or land cover? Visualizing Florida's Complex Landscape [GIS Shapefile]. Tallahassee: Florida Resources and Environmental Analysis Center, Florida State University.